FRC 254’s Unbeatable Year
In 2018, FRC team 254 won every onseason match they played.
That’s insane.
Like really.
Backing up a little…
FIRST Robotics Competition (FRC) is a high school robotics competition. Each year teams are given a challenge and are given six weeks to build a robot to complete the challenge. Each game features six teams, organized into two alliances (red and blue), competing for the highest score over the course of two minutes and 30 seconds, with the first 15 seconds having the robots controlled autonomously, and the remaining 2:15 teleoperated. In 2018, the game was called Power Up.
Power Up featured three seesaws, two “switches” at the on each side of the field and one “scale” in the center. Teams could place “Power Cubes” (which I’ll just call cubes) on their side of the seesaws, weighing them down, gaining “ownership”. When an alliance owned the scale or their own switch, they would score one point per second (alliances don’t get points for ownership of the opposing switch). At the end of the match teams could score more points by hanging onto the scale.
The Cheesy Poofs
Team 254, The Cheesy Poofs is the best FRC team by almost any metric, to the point that it’s almost a joke. They’ve been a team since 1999, and since then have won so many awards that their page on TBA just keeps going past the text.
 from thebluealliance
Winrate
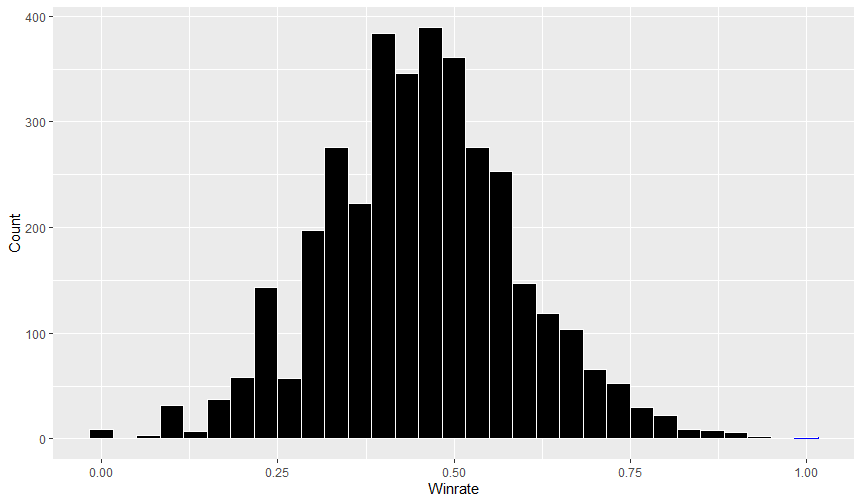
254’s 2018 went 53-0-0, giving them a winrate of 1, here’s everyone else.
- Team 148 had the second highest winrate of 0.927.
- 9 teams had a winrate of zero, losing every match they were in.
- 252 teams had a winrate of exactly 0.5, winning half of their matches.
 data from thebluealliance
Point of Comparison
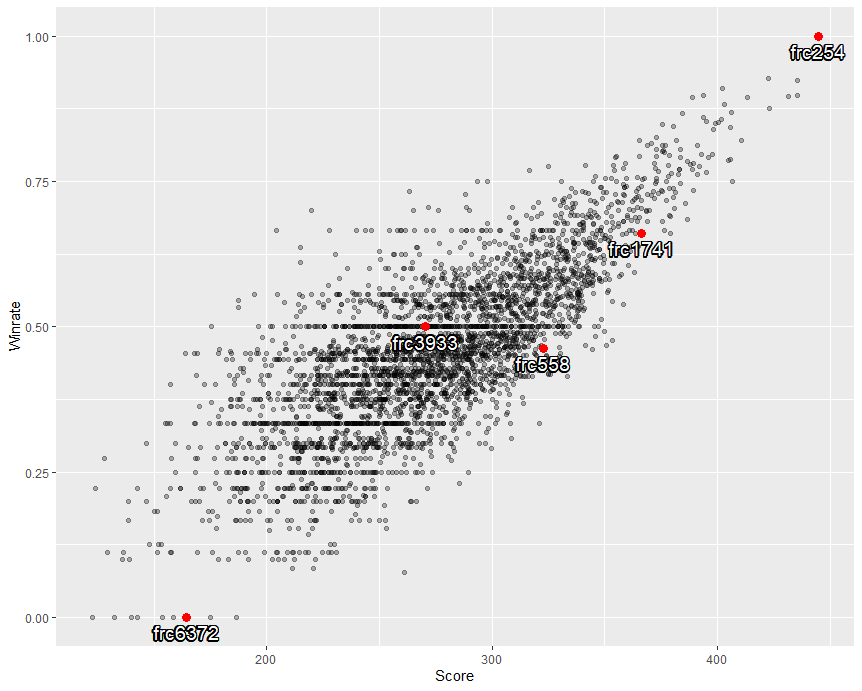
In each of these charts, five teams have been highlighted.
- Team 254: The focus of this page
- Team 558: My personal favorite robot
- Team 1741: The team I was on in 2018
- Team 3933: A team with a 0.5 winrate that went to more than one competition (including Worlds)
- Team 6541: One of the teams with a 0 winrate, which has a complete dataset
Score vs. Winrate
 data from thebluealliance
Obviously winrate is correlated with how high a team scores on average.
Score Difference vs. Winrate
 data from thebluealliance
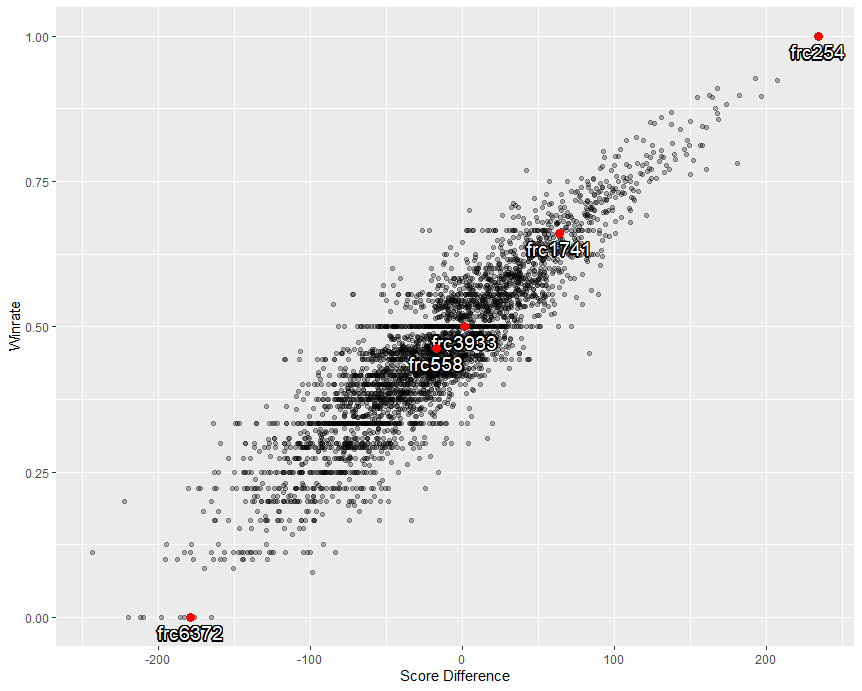
Another similar metric is the average difference between a teams score and the opposing alliance’s score. 254 had the highest average score difference, beating other alliances by 234.3 points. In the 2018 season, 809 teams (22.4%) did not have an average score over 254’s average score difference.
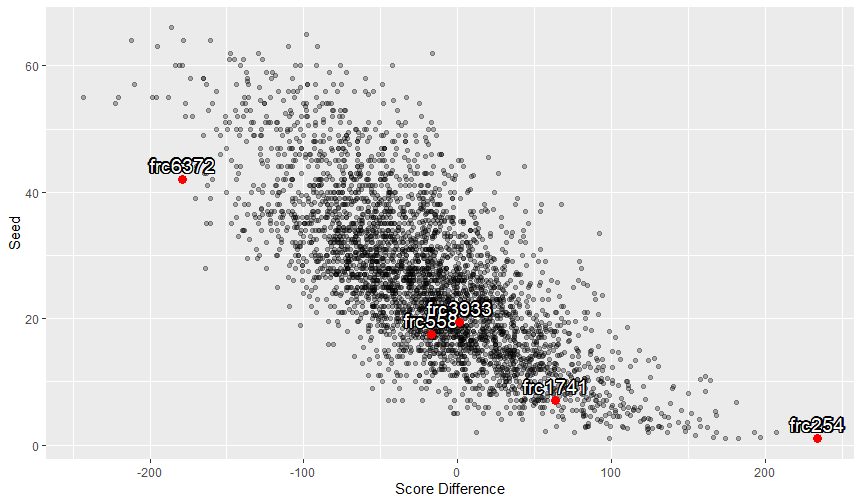
Score Difference vs. Seed
 data from thebluealliance
During qualification matches, teams get Ranking Points (RP) for winning, getting a tie, or for completing specific, more difficult tasks during the match. 4 teams, including 254, placed first seed at every competition they went to. It is also important to note that different competitions have different numbers of teams, so the lowest rank is a range [figure that out?].
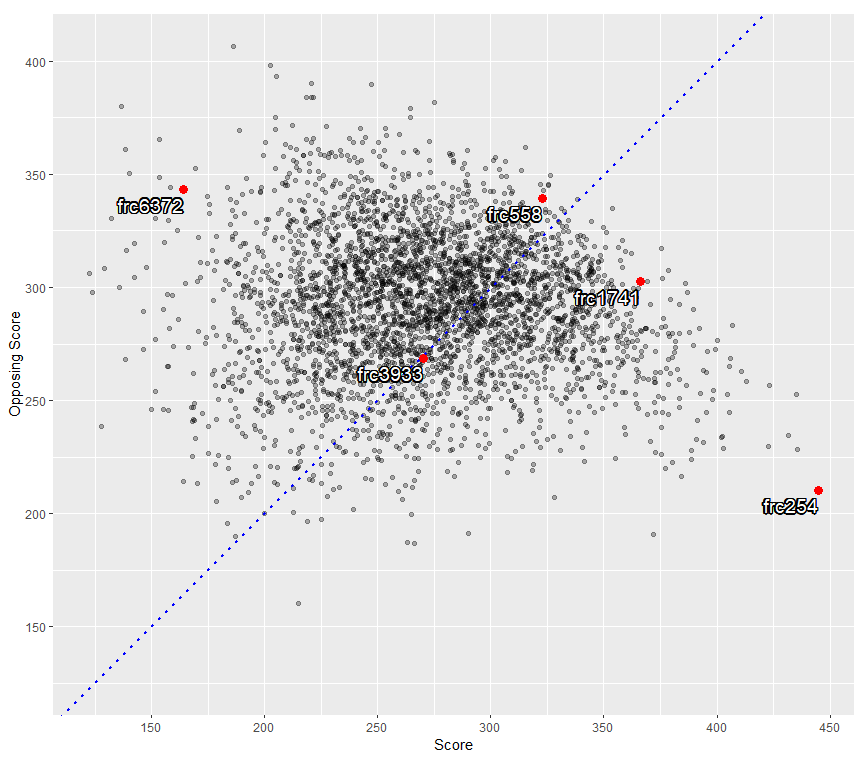
Score vs. Opposing Score
 data from thebluealliance
This chart is a bit more muddy due to the nature of the game. The blue line shows where Score = Opposing Score, teams below had a positive average score difference, teams above had a negative average score difference. If both alliances were able to score on their switch but never descored the opposing switch, then both alliances could receive a reasonable amount of points. Most strategies revolved around claiming ownership of the scale, with most teams only ever attempting to claim the opposing switch either because they were trying to distract the other alliance, or because they already had very solid control of the scale. 254 was often in the latter situation, leading to their low opposing score.
Match Timeseries
Due to scoring taking place on a second-by-second basis in 2018, the thebluealliance dataset also contains a timeseries for many matches.
Using these timeseries, I can find a new statistics about teams, such as:
- How long it took for them to first score their switch
- How long it took for them to first score the scale
- What percentage of the time did they own their own switch
- What percentage of the time did they own the scale
- What percentage of the time did they own the opposing alliance’s switch
Time to Ownership
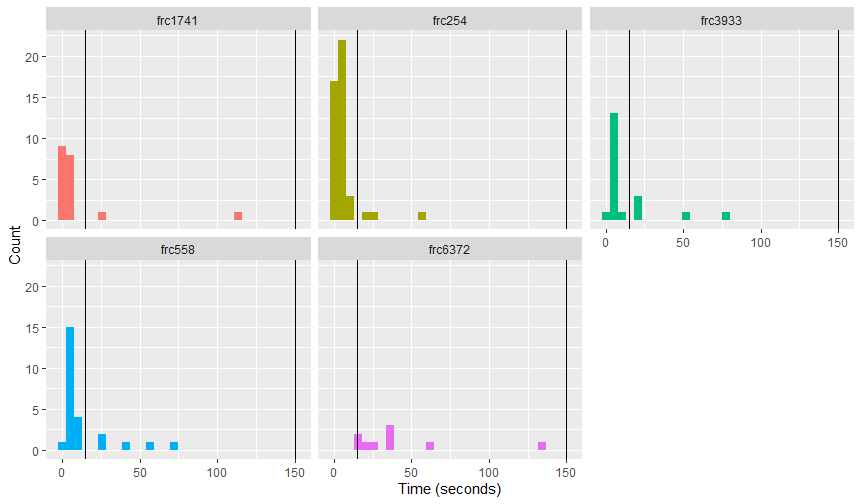
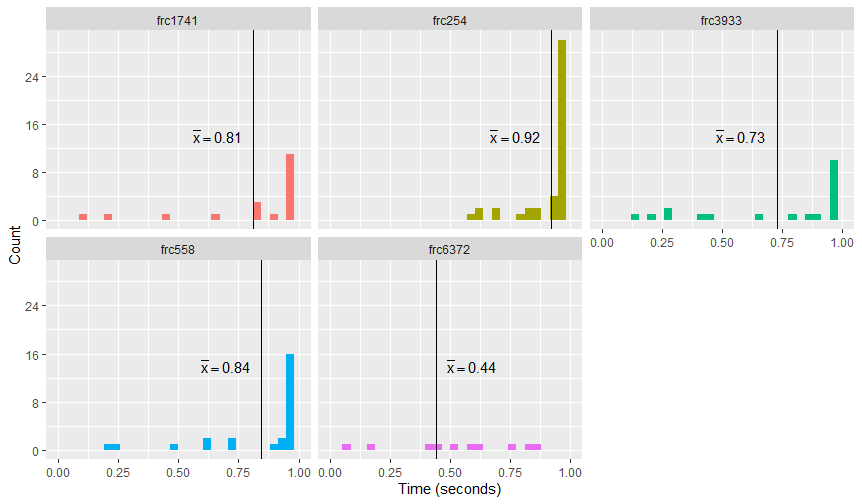
Each of these sets of charts shows a histogram of how long it took a team to gain ownership of either their own switch or the scale. The first vertical line shows when the autonomous period ends, the second shows when the match ends.
Time to Own Switch (for the first time)
 data from thebluealliance
Most teams were either able to score the switch on their own during autonomous, or had a alliance partner that was able to.
Some datapoints are missing from these charts, as there were four total occasions where an alliance did not score their switch the entire match. Once for 558 and three times for 6372.
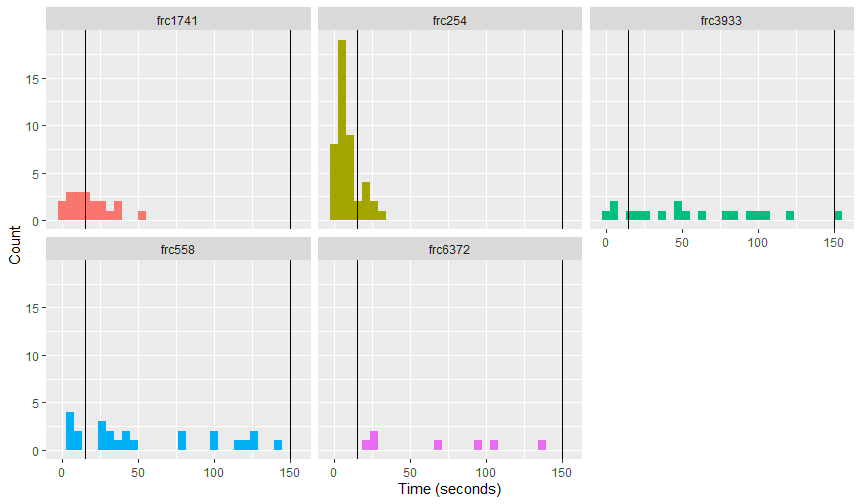
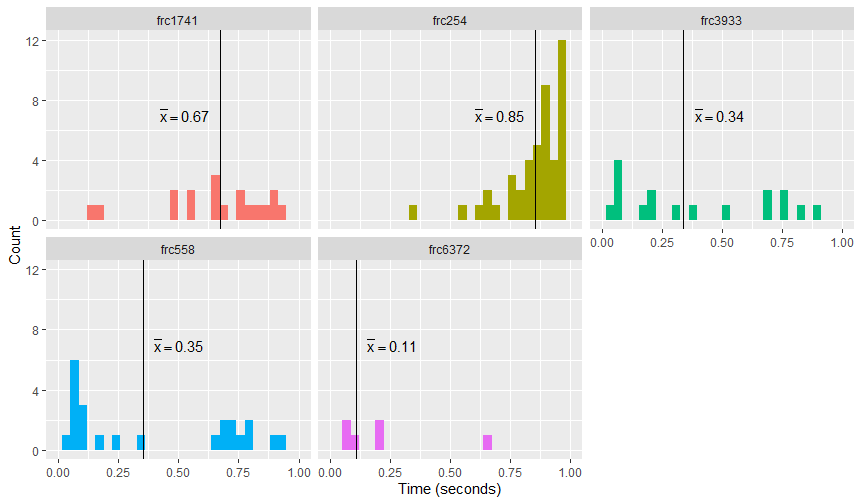
Time to Own Scale (for the first time)
 data from thebluealliance
Over the course of the season, more and more teams were able to score a cube onto the scale during autonomous. 254 was one of the few teams to have a counterplay: score two cubes. This lead to them almost always leaving autonomous with ownership of the scale, later picking up a third ready for when teleoperated started.
Once again, not all teams were able to score the scale in a match. Out of these teams, it happened nine times. Twice for 558, twice for 3933, and five times for 6372.
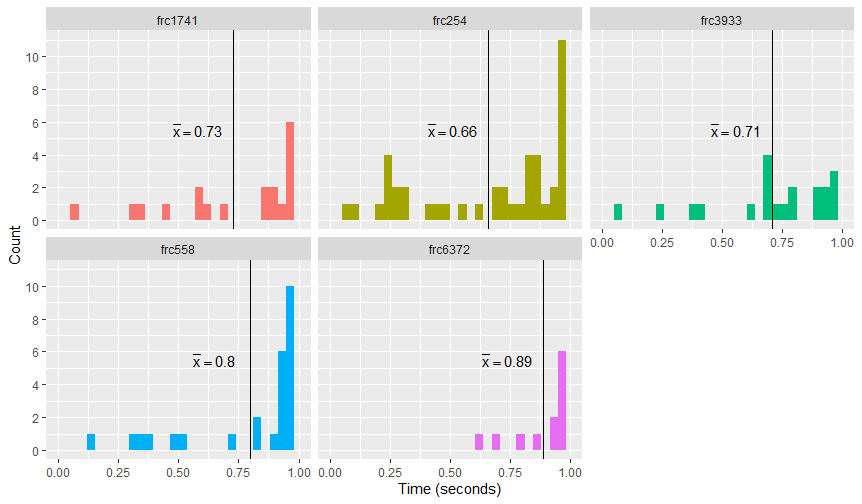
Ownership Ratios
Each of these charts shows a histogram of the ratios of the time that a team owned a switch or scale during a match to the total amount of time in the match.
Switch Ownership Ratio
 data from thebluealliance
254 performed the best out of this set of teams, having control of their own switch 92% of the time they were on the field. Based on how early they were able to claim their switch, it makes sense that they have ownership of it for so much of their time. When teams controlled their switch for a greater portion of their time playing, they performed better.
Scale Ownership Ratio
 data from thebluealliance
The scale is an interesting case because not all teams could reliably score on it. In this subset, this is 558 and 6372, although 558’s shooter was normally able to score in the scale during autonomous. Because both alliances could score from the scale, in less one-sided matches it would tip back and forth between alliances. 254 gained ownership during auto a lot, many times with two or more cubes further in the season. Here’s their last match where they score four cubes during the 15 second autonomous:
 from here
Opposing Switch Ownership Ratio
 data from thebluealliance
This chart is slightly different because it shows the ratios of the opposing alliance, the opposing alliance not owning their scale is better for an alliance. The opposing switch was usually a lofty goal for an alliance. It doesn’t give them points, it only makes it so the other alliance doesn’t get points. However, claiming the opposing switch was usually easier than the scale, making it a good distraction tactic for while trying to claim or defend the scale. Teams that were better tended to claim the opposing switch. 254 managed to take ownership of the opposing switch for a third of the time they were in a match, in contrast to 6372, where the opposing alliance owned their switch more often than 254 owned theirs.
Interesting Matches
While going through and double-checking data, I found a handful of matches that are just kind of interesting.
- 6372 never actually claims their switch or the scale
- 254’s second highest score difference, because their highest was just the other alliance getting penalties
- This match with 3933 had the scale balanced for a total of a minute, ending with a 3 point difference
- 1741’s opponent scores very good (but because of penalties)
- Here is one of the few times that 558 actually uses their shooter
Code
- For scraping the thebluealliance api, I used nodejs, link
- For processing the resulting data into charts, I used R with ggplot2, link
Citation
All data sourced from thebluealliance api v3